A useful HTTP error investigation answers three questions: what exact request was sent, which component produced the response, and what smallest change makes the behavior different? Guessing from a status alone—“404 means the route is missing” or “500 means the backend crashed”—often sends the investigation to the wrong layer.
1. Freeze the failing request
Before retrying, save the method, complete URL, query string, non-secret headers, body, timestamp, status, response headers, response body, and request or trace ID. Redact secrets without deleting the header names.
Why first? Tokens expire, records change, deployments move, and retries can succeed. Without the original snapshot, the most valuable comparison disappears.
2. Use the status family to choose a starting point
| Status | Start by checking |
|---|---|
| 400 Bad Request | Malformed syntax, JSON parsing, invalid query format, missing required input |
| 401 Unauthorized | Missing or invalid authentication; see the 401 guide |
| 403 Forbidden | Scopes, roles, ownership, policy, IP restrictions |
| 404 Not Found | Host, base path, API version, route, resource identifier, gateway rewrite |
| 409 Conflict | Duplicate resource, stale version, idempotency, state transition |
| 415 Unsupported Media Type | Content-Type and actual body encoding |
| 422 Unprocessable Content | Field-level validation and business rules |
| 429 Too Many Requests | Rate-limit headers, retry policy, concurrency, caller identity |
| 500–504 | Application exception, dependency failure, timeout, gateway/upstream health |
This table is a triage map, not proof. A gateway can turn an upstream timeout into 500, and some applications return 404 to hide forbidden resources.
3. Identify which layer answered
Compare response headers and body style with known responses. A CDN, load balancer, API gateway, framework, and application may each produce a different error format. Server banners, trace IDs, gateway-specific headers, and HTML-versus-JSON bodies provide clues.
- Confirm DNS and the final hostname.
- Check whether HTTP redirects changed the host or method.
- Look for gateway and upstream request IDs.
- Compare the error body's schema with documented application errors.
- For 502–504, verify dependency health and timeout boundaries.
4. Find the nearest known-good request
The best comparison uses the same environment, host, endpoint family, authentication method, and client. Compare raw values systematically: scheme, host, path casing, query encoding, content type, authorization, cookies, body shape, and API version.
If no known-good call exists, construct the smallest valid request from the contract as described in How to Test a REST API Without a Frontend.
5. Change one variable per retry
Remove optional headers. Reduce the body to required fields. Use a known resource ID. Replace only the credential. Try the documented content type. After every attempt, record what changed and the new result.
6. Read the body and headers as diagnostic data
Good APIs return a stable error code, human-readable message, field details, and request ID. Rate-limit responses may include Retry-After. Authentication responses may include WWW-Authenticate. A 201 may include Location.
Do not expose stack traces or database errors to clients, but do preserve deeper details in protected server logs linked by the same request ID.
7. Correlate with logs and dependencies
Search gateway and application logs using the request ID and narrow timestamp window. For 5xx responses, follow downstream calls: database, cache, identity provider, queue, or third-party API. Compare the client's elapsed time with server spans. A client timeout can occur even if the server eventually records success.
8. Write a replayable bug report
A strong report includes environment, sanitized request, expected result, actual status/body, timestamp with timezone, request ID, frequency, and the smallest discovered trigger. Avoid “endpoint broken” or screenshots with no request details.
Environment: staging
Endpoint: POST /v1/orders
Expected: 201 with order_id
Actual: 422, code INVALID_QUANTITY
Trigger: quantity changes from 1 to 0
Request ID: req_7f3a91d2
First observed: 2026-08-13 08:42 UTC
HTTP error debugging checklist
- Preserve the first failing exchange.
- Redact values, not diagnostic header names.
- Identify the responding layer.
- Compare the nearest known-good request.
- Change exactly one variable per retry.
- Use response headers and stable error codes.
- Correlate request IDs across gateway, app, and dependencies.
- Document a minimal replay rather than a theory.
Keep failed and working calls close together
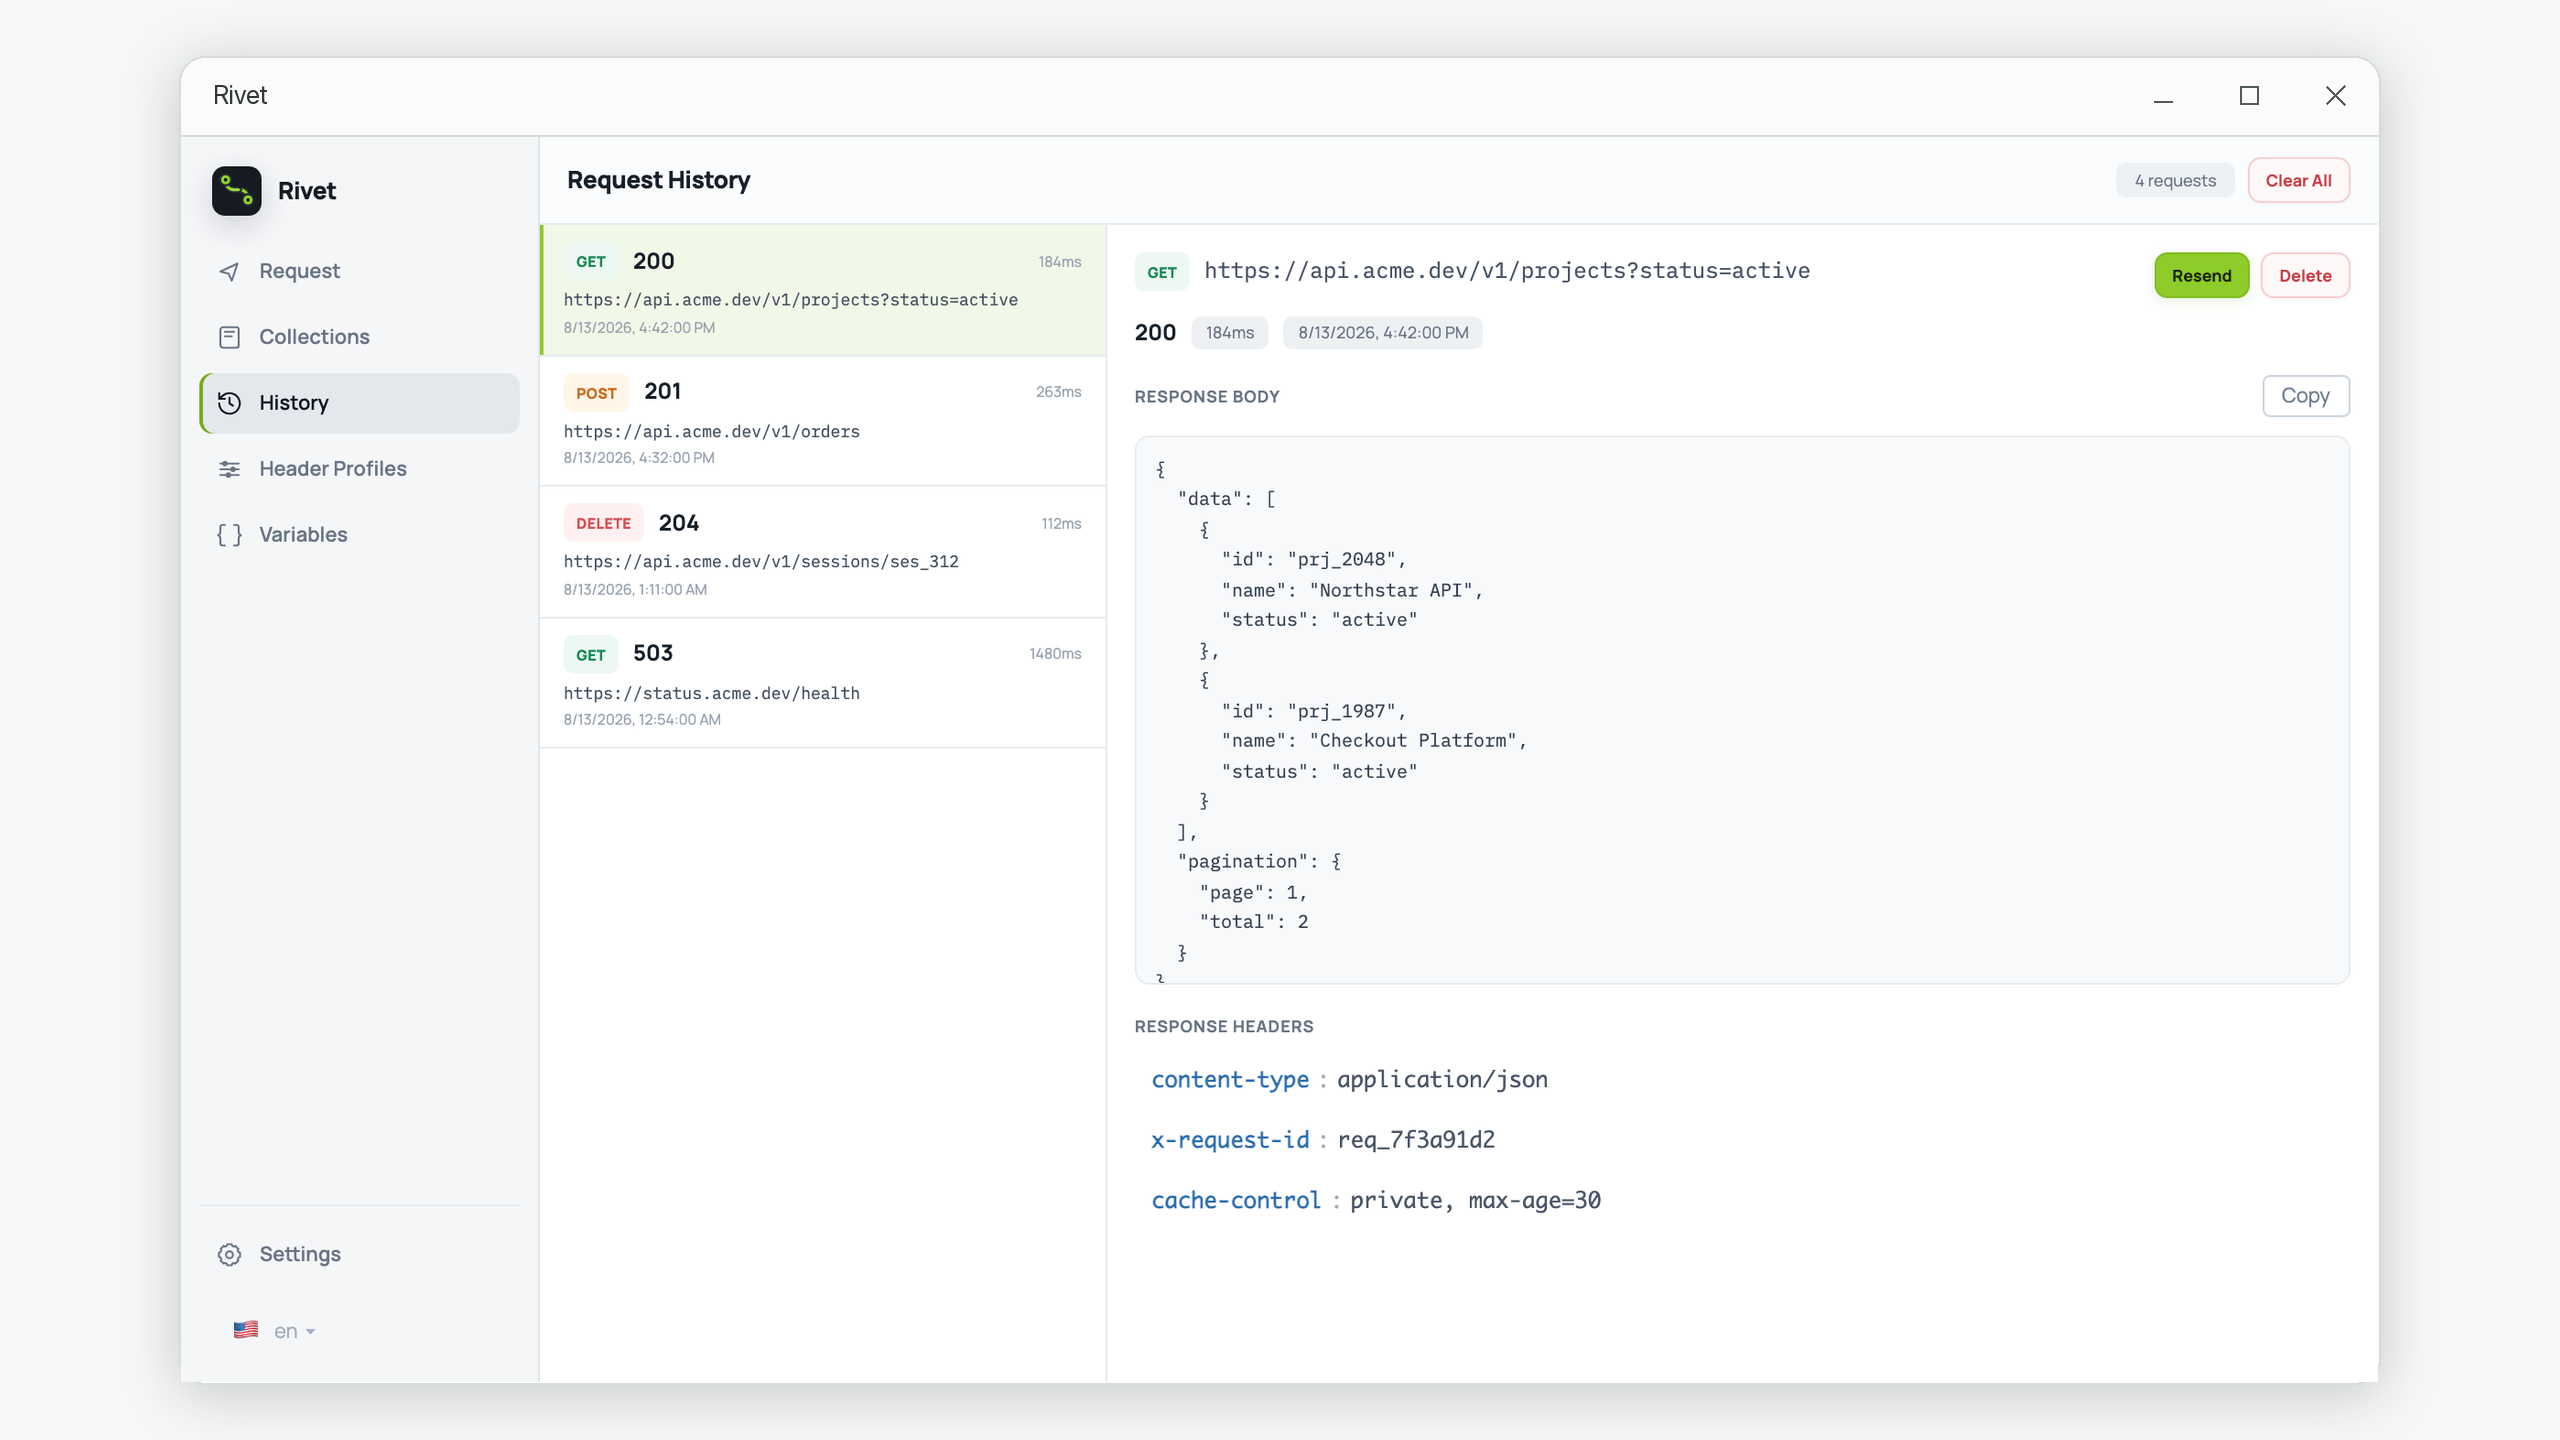
Rivet's local request history helps you reopen an earlier request, compare its response, and resend the smallest change.
Get Rivet from Microsoft Store